Adding Realtime Updates in MVVM
Realtime updates in MVVM are a doddle. Now that you've bound your SciChartSurface to a ViewModel, all you need to do is manipulate the XyDataSeries in the ViewModel and the chart will automatically udpate.
We're going to do this properly and add a new class to provide values. This class will 'simulate' an external service or dataprovider to add updates to the chart.
Create a new class called DummyDataProvider and add the following code:
| DummyDataProvider: A service to provide dummy data values in realtime |
Copy Code |
|---|---|
using System; using System.Collections.Generic; using System.Windows.Threading; namespace SciChart.Mvvm.Tutorial { public interface IDataProvider { XyValues GetHistoricalData(); void SubscribeUpdates(Action<XyValues> onDataUpdated); } public struct XyValues { public IList<double> XValues; public IList<double> YValues; } public class DummyDataProvider : IDataProvider { private readonly Random _random = new Random(); private double _last; private readonly double _bias = 0.01; private int _i = 0; public XyValues GetHistoricalData() { const int initialDataCount = 1000; return GenerateRandomWalk(initialDataCount); } public void SubscribeUpdates(Action<XyValues> onDataUpdated) { // Don't do this in design mode! Or you will get an Out of memory exception in XAML Designer bool designMode = (LicenseManager.UsageMode == LicenseUsageMode.Designtime); if (designMode) return; // Subcribes to updates and pushes to viewmodels DispatcherTimer timer = new DispatcherTimer(DispatcherPriority.Render); timer.Interval = TimeSpan.FromMilliseconds(20); timer.Tick += (s, e) => { var xyValues = GenerateRandomWalk(10); onDataUpdated(xyValues); }; timer.Start(); } private XyValues GenerateRandomWalk(int count) { XyValues values = new XyValues() { XValues = new List<double>(), YValues = new List<double>(), }; for (int i = 0; i < count; i++) { double next = _last + (_random.NextDouble() - 0.5 + _bias); _last = next; values.XValues.Add(_i++); values.YValues.Add(next); } return values; } } } | |
Next, we're going to use this when we instantiate our MainViewModel. In MainViewModel.cs add the following parameter to the ChartViewModel constructor:
You will need to modify your ChartViewModel constructor to use the new DataProvider service as well:
| Modify ChartViewModel.cs |
Copy Code |
|---|---|
public MainViewModel() { var dummyDataProvider = new DummyDataProvider(); var lineData = new XyDataSeries<double, double>() { SeriesName = "TestingSeries" }; _renderableSeries = new ObservableCollection<IRenderableSeriesViewModel>(); RenderableSeries.Add(new LineRenderableSeriesViewModel() { StrokeThickness = 2, Stroke = Colors.SteelBlue, DataSeries = lineData, StyleKey = "LineSeriesStyle" }); // Append the initial values to the chart var initialDataValues = dummyDataProvider.GetHistoricalData(); lineData.Append(initialDataValues.XValues, initialDataValues.YValues); // Subscribe to future updates dummyDataProvider.SubscribeUpdates((newValues) => { // Append when new values arrive lineData.Append(newValues.XValues, newValues.YValues); // Zoom the chart to fit lineData.InvalidateParentSurface(RangeMode.ZoomToFit); }); } | |
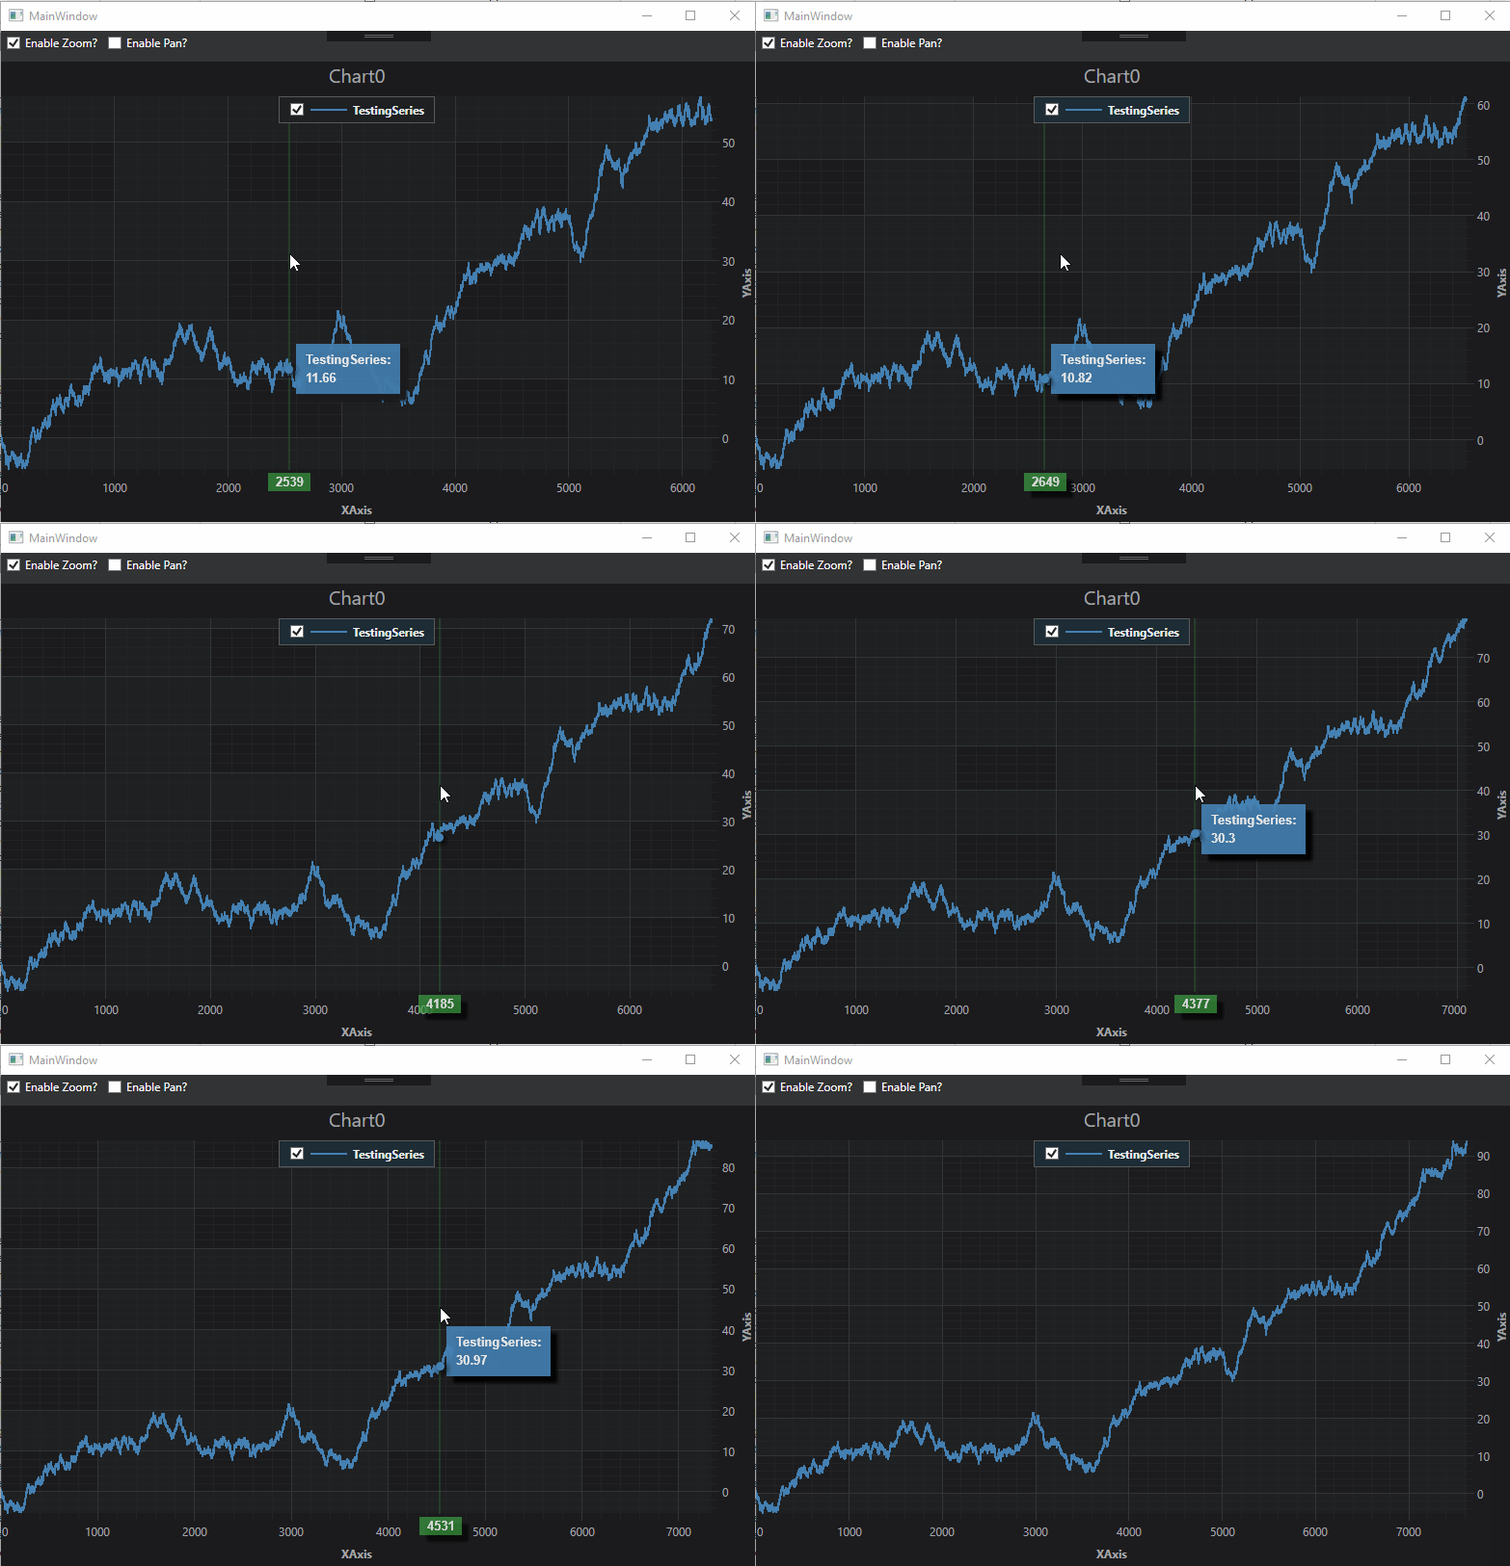
Now run the application. You should see your chart updating in real-time!

